
The Missouri Health Data Reports include data from the Missouri County-Level Study (CLS), the Behavioral Risk Factor Surveillance System (BRFSS), and the Youth Risk Behavior Surveillance System (YRBSS). It allows you to quickly and easily create customized reports for your county or region.
Begin by defining your report location, then select the data you want to include from either the 2016 and 2022 Missouri County-Level Studies or the BRFSS data from 2014-2024. Your completed report can be used for various purposes, including meeting reporting requirements, supporting grant applications, and informing the programs and services you offer to your community. Updates now reflect the inclusion of 2016 CLS data alongside the 2022 CLS and BRFSS data, ensuring a comprehensive view of health data across Missouri.
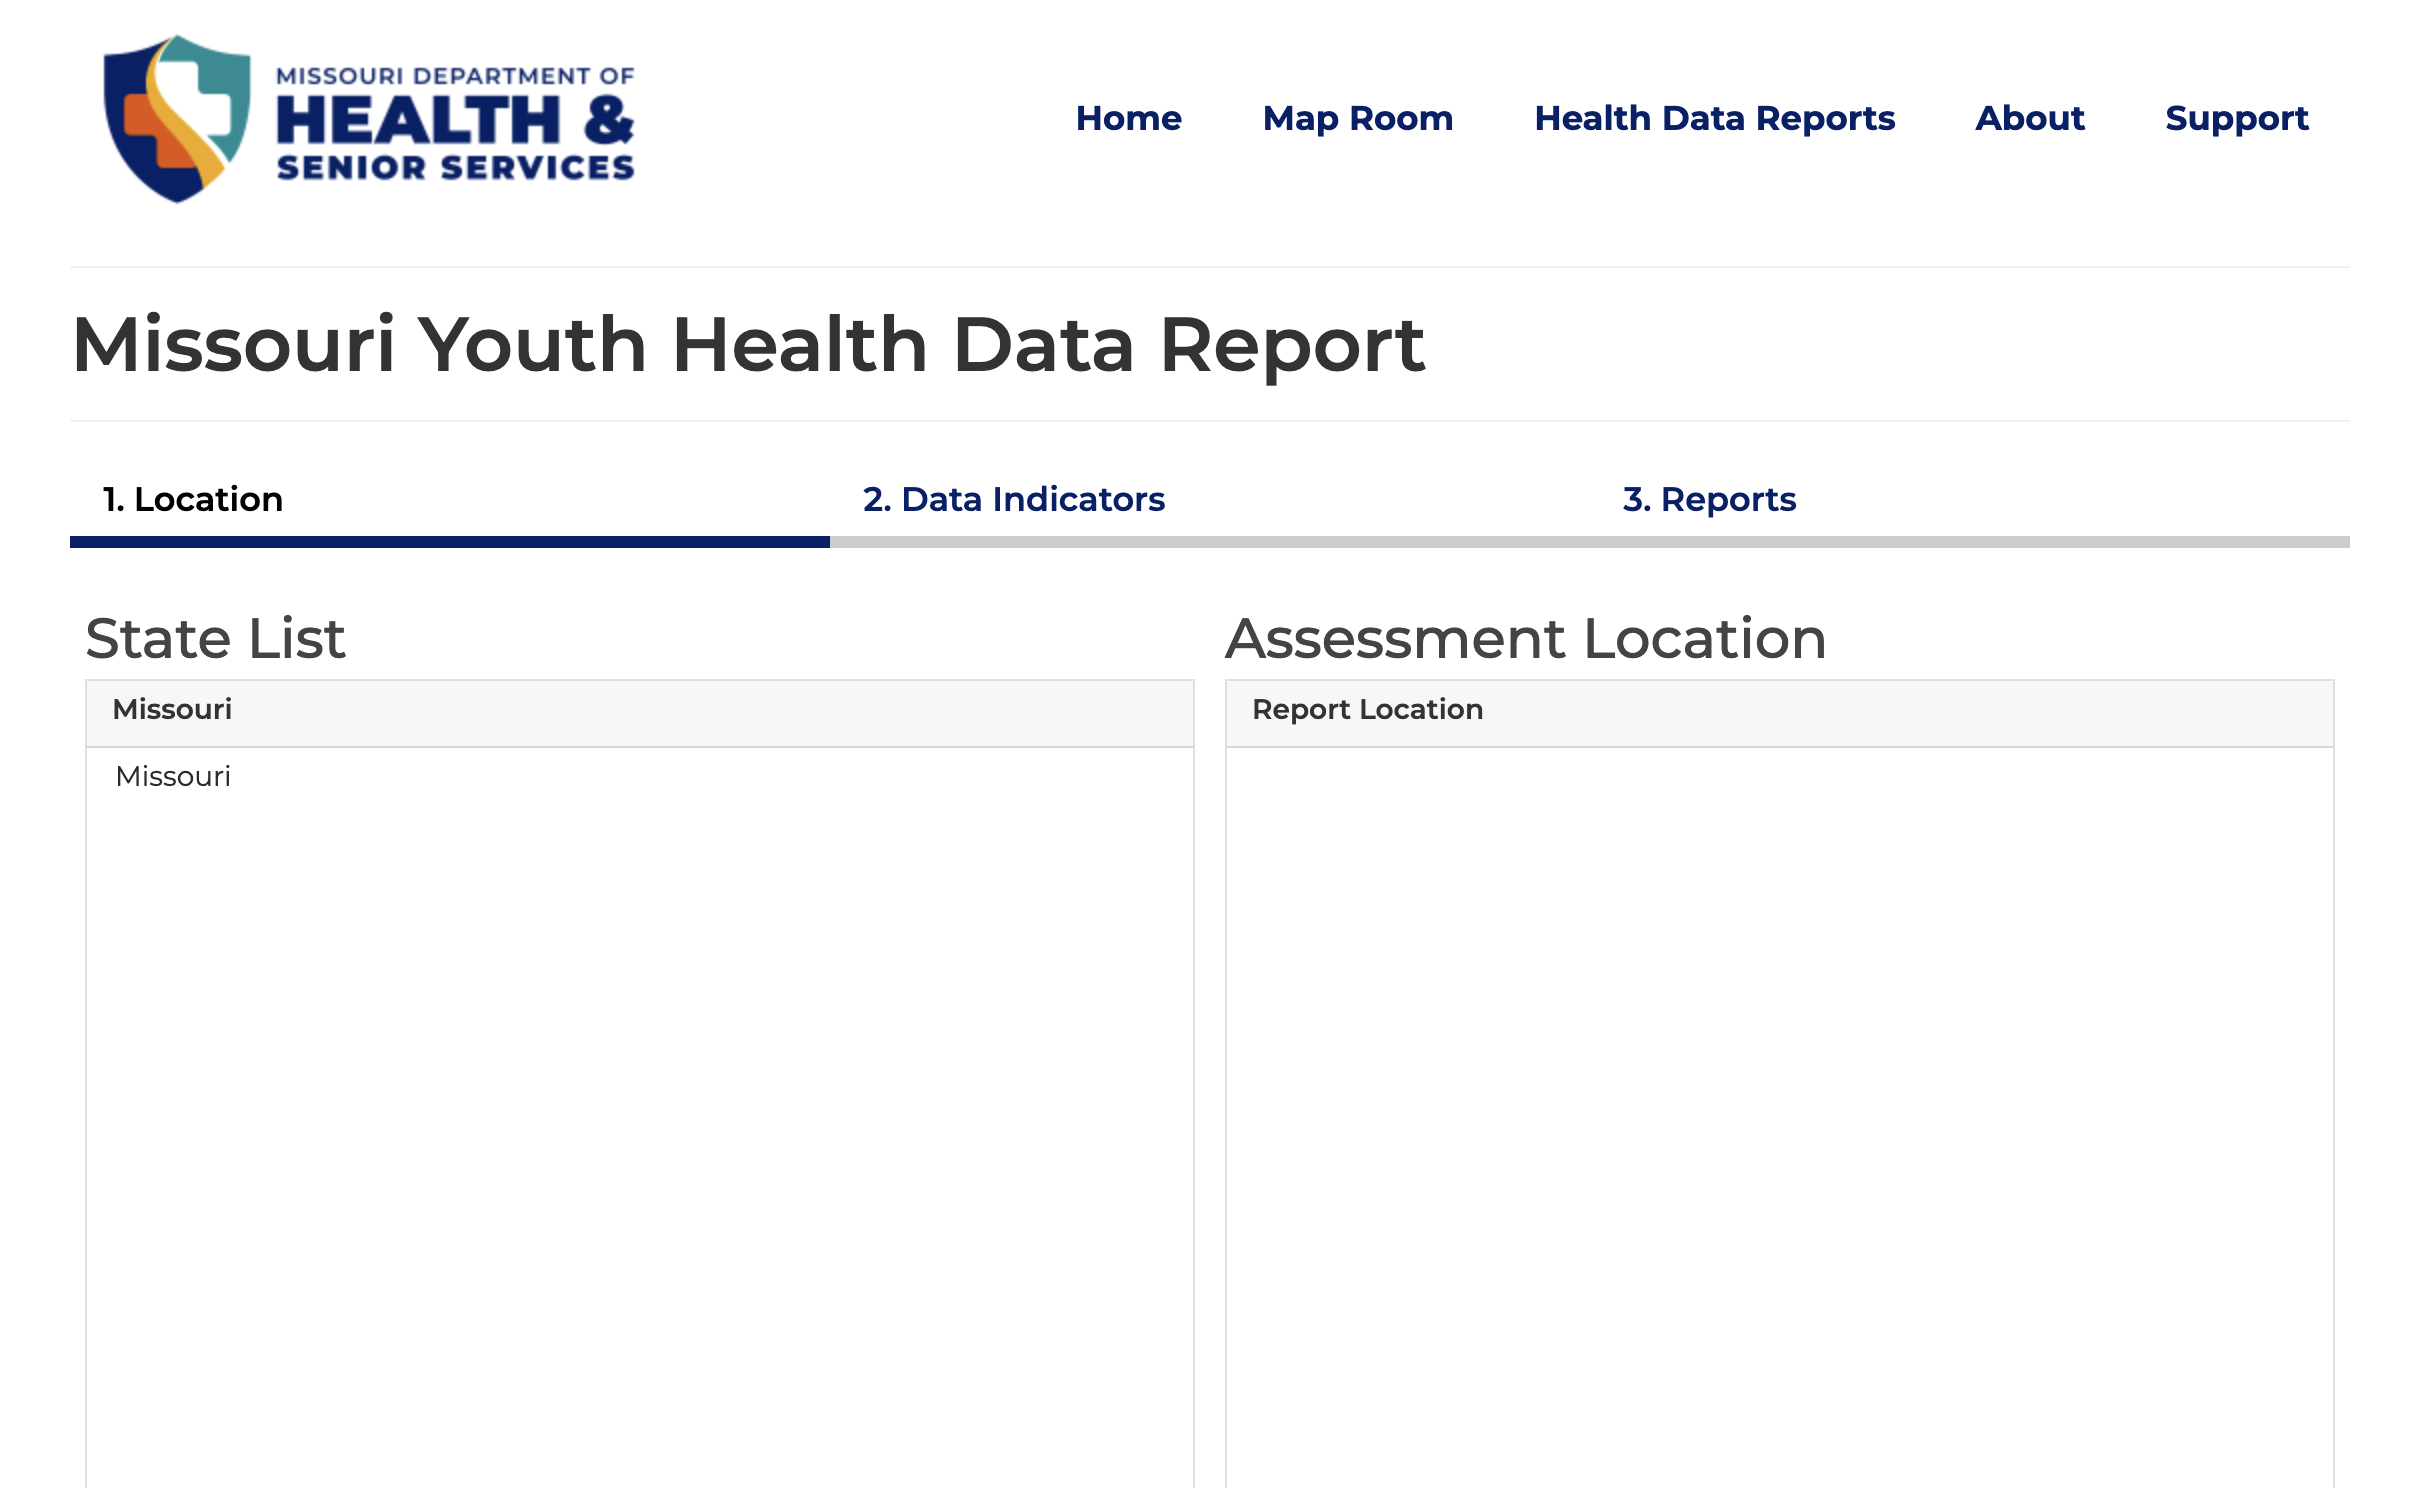
The Missouri Youth Health Data Report is also available for users to view statewide data and trends for the youth population and select youth demographic groups compared to national benchmarks.
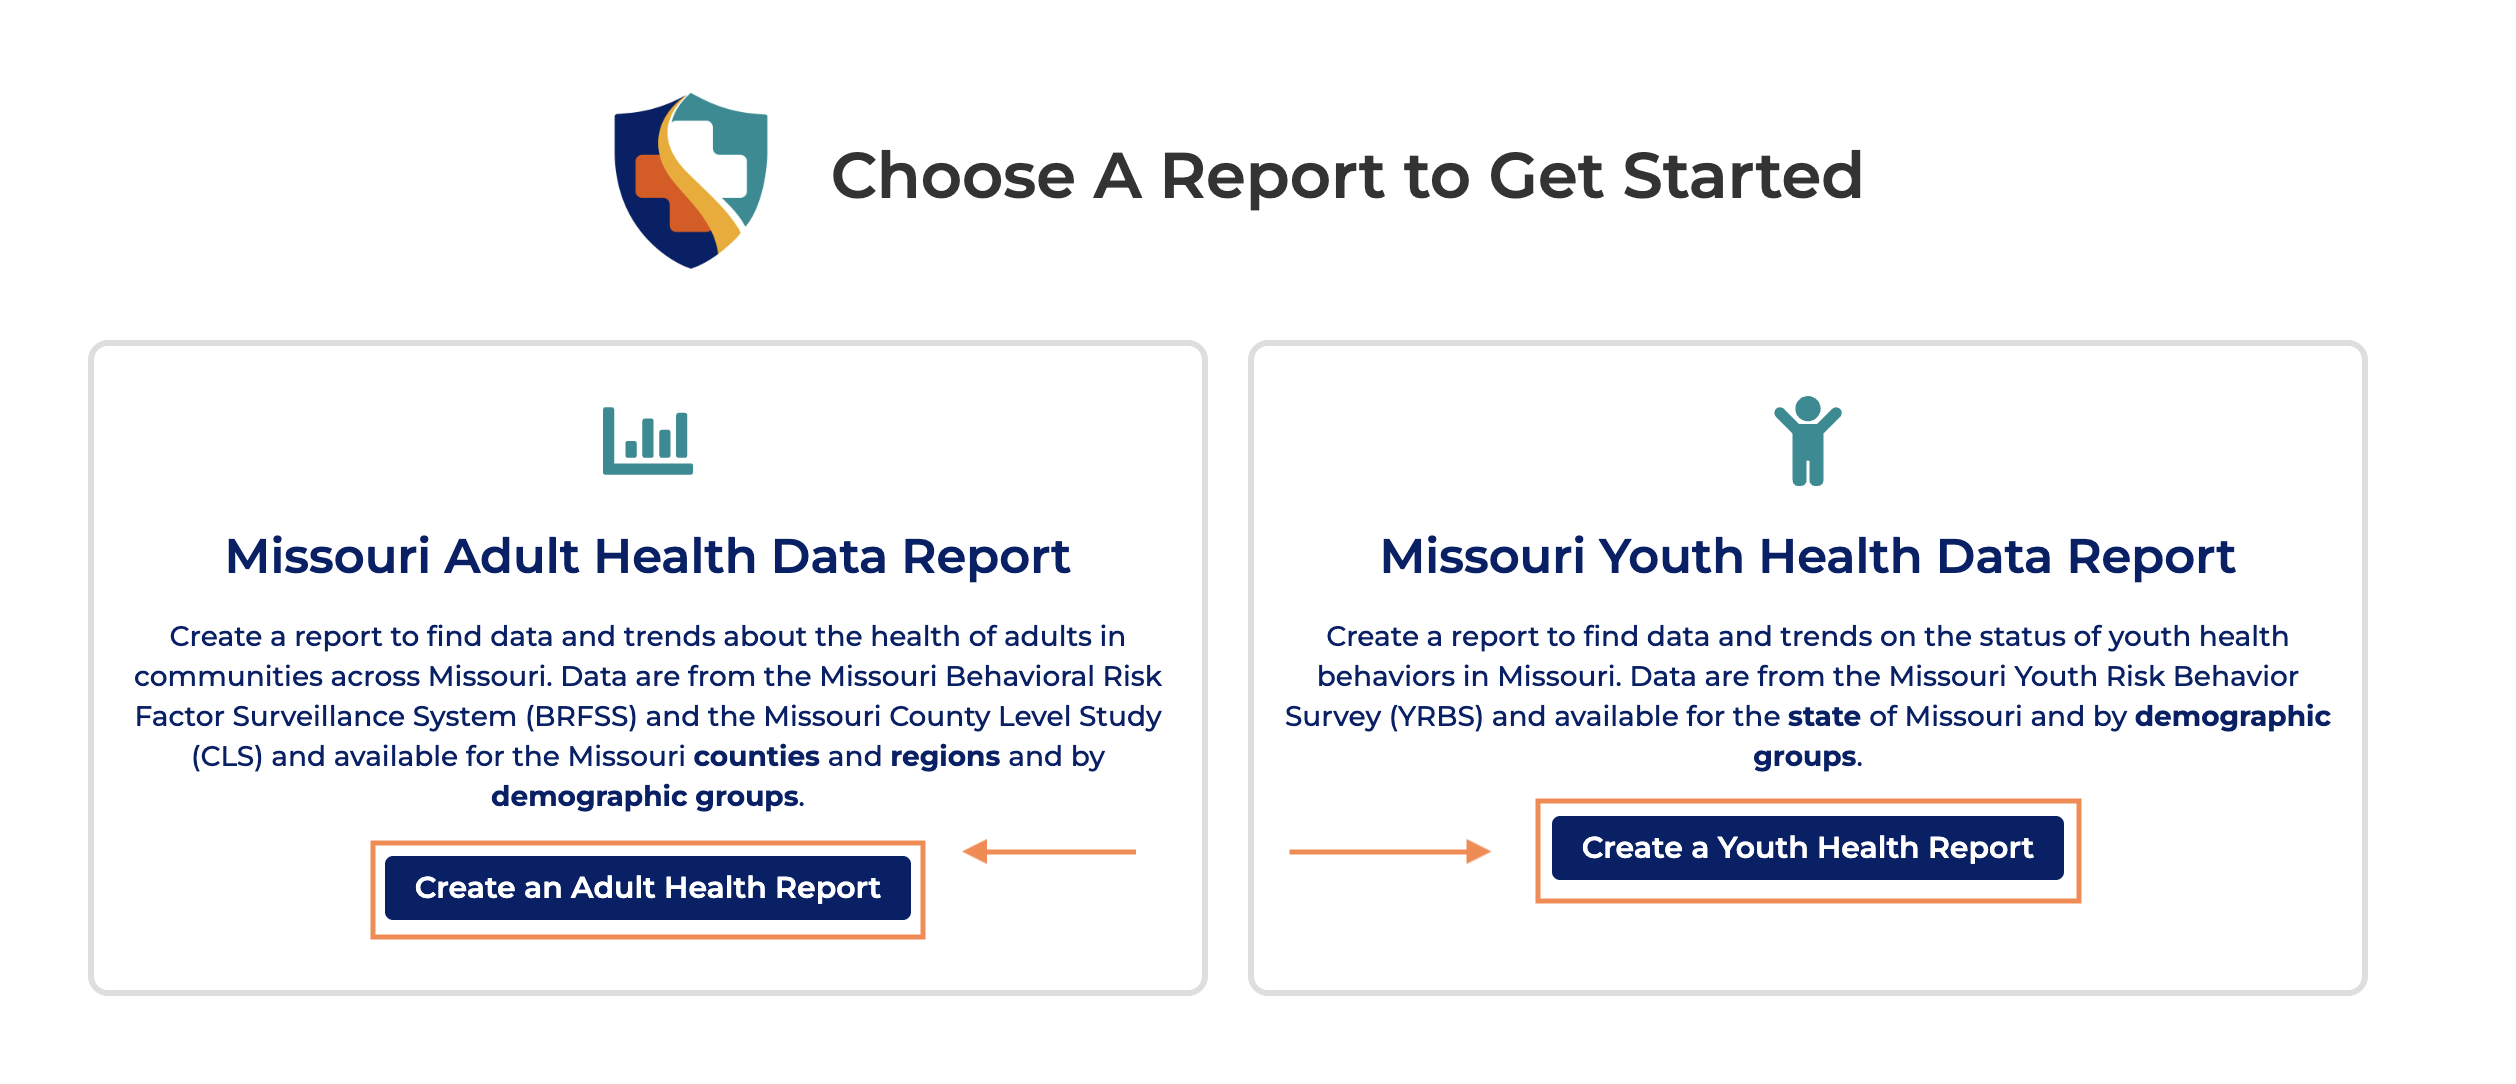
Start Here – Choose Your Report Type
The Missouri Adult Health Data Report uses data from the BRFSS and the County Level Study. This report is best for users who want to see county or regional data or comparisons, find data about chronic conditions and adult health behaviors, or find differences across socio-economic groups.
The Missouri Youth Health Data Report uses data from the YRBSS. This report is best for users who want to view data and trends for the state of Missouri compared to national averages and those who wish to view data about youth health and health behaviors, including mental health.
Note: Region and county-level data are not available for the Youth Health Data Report.
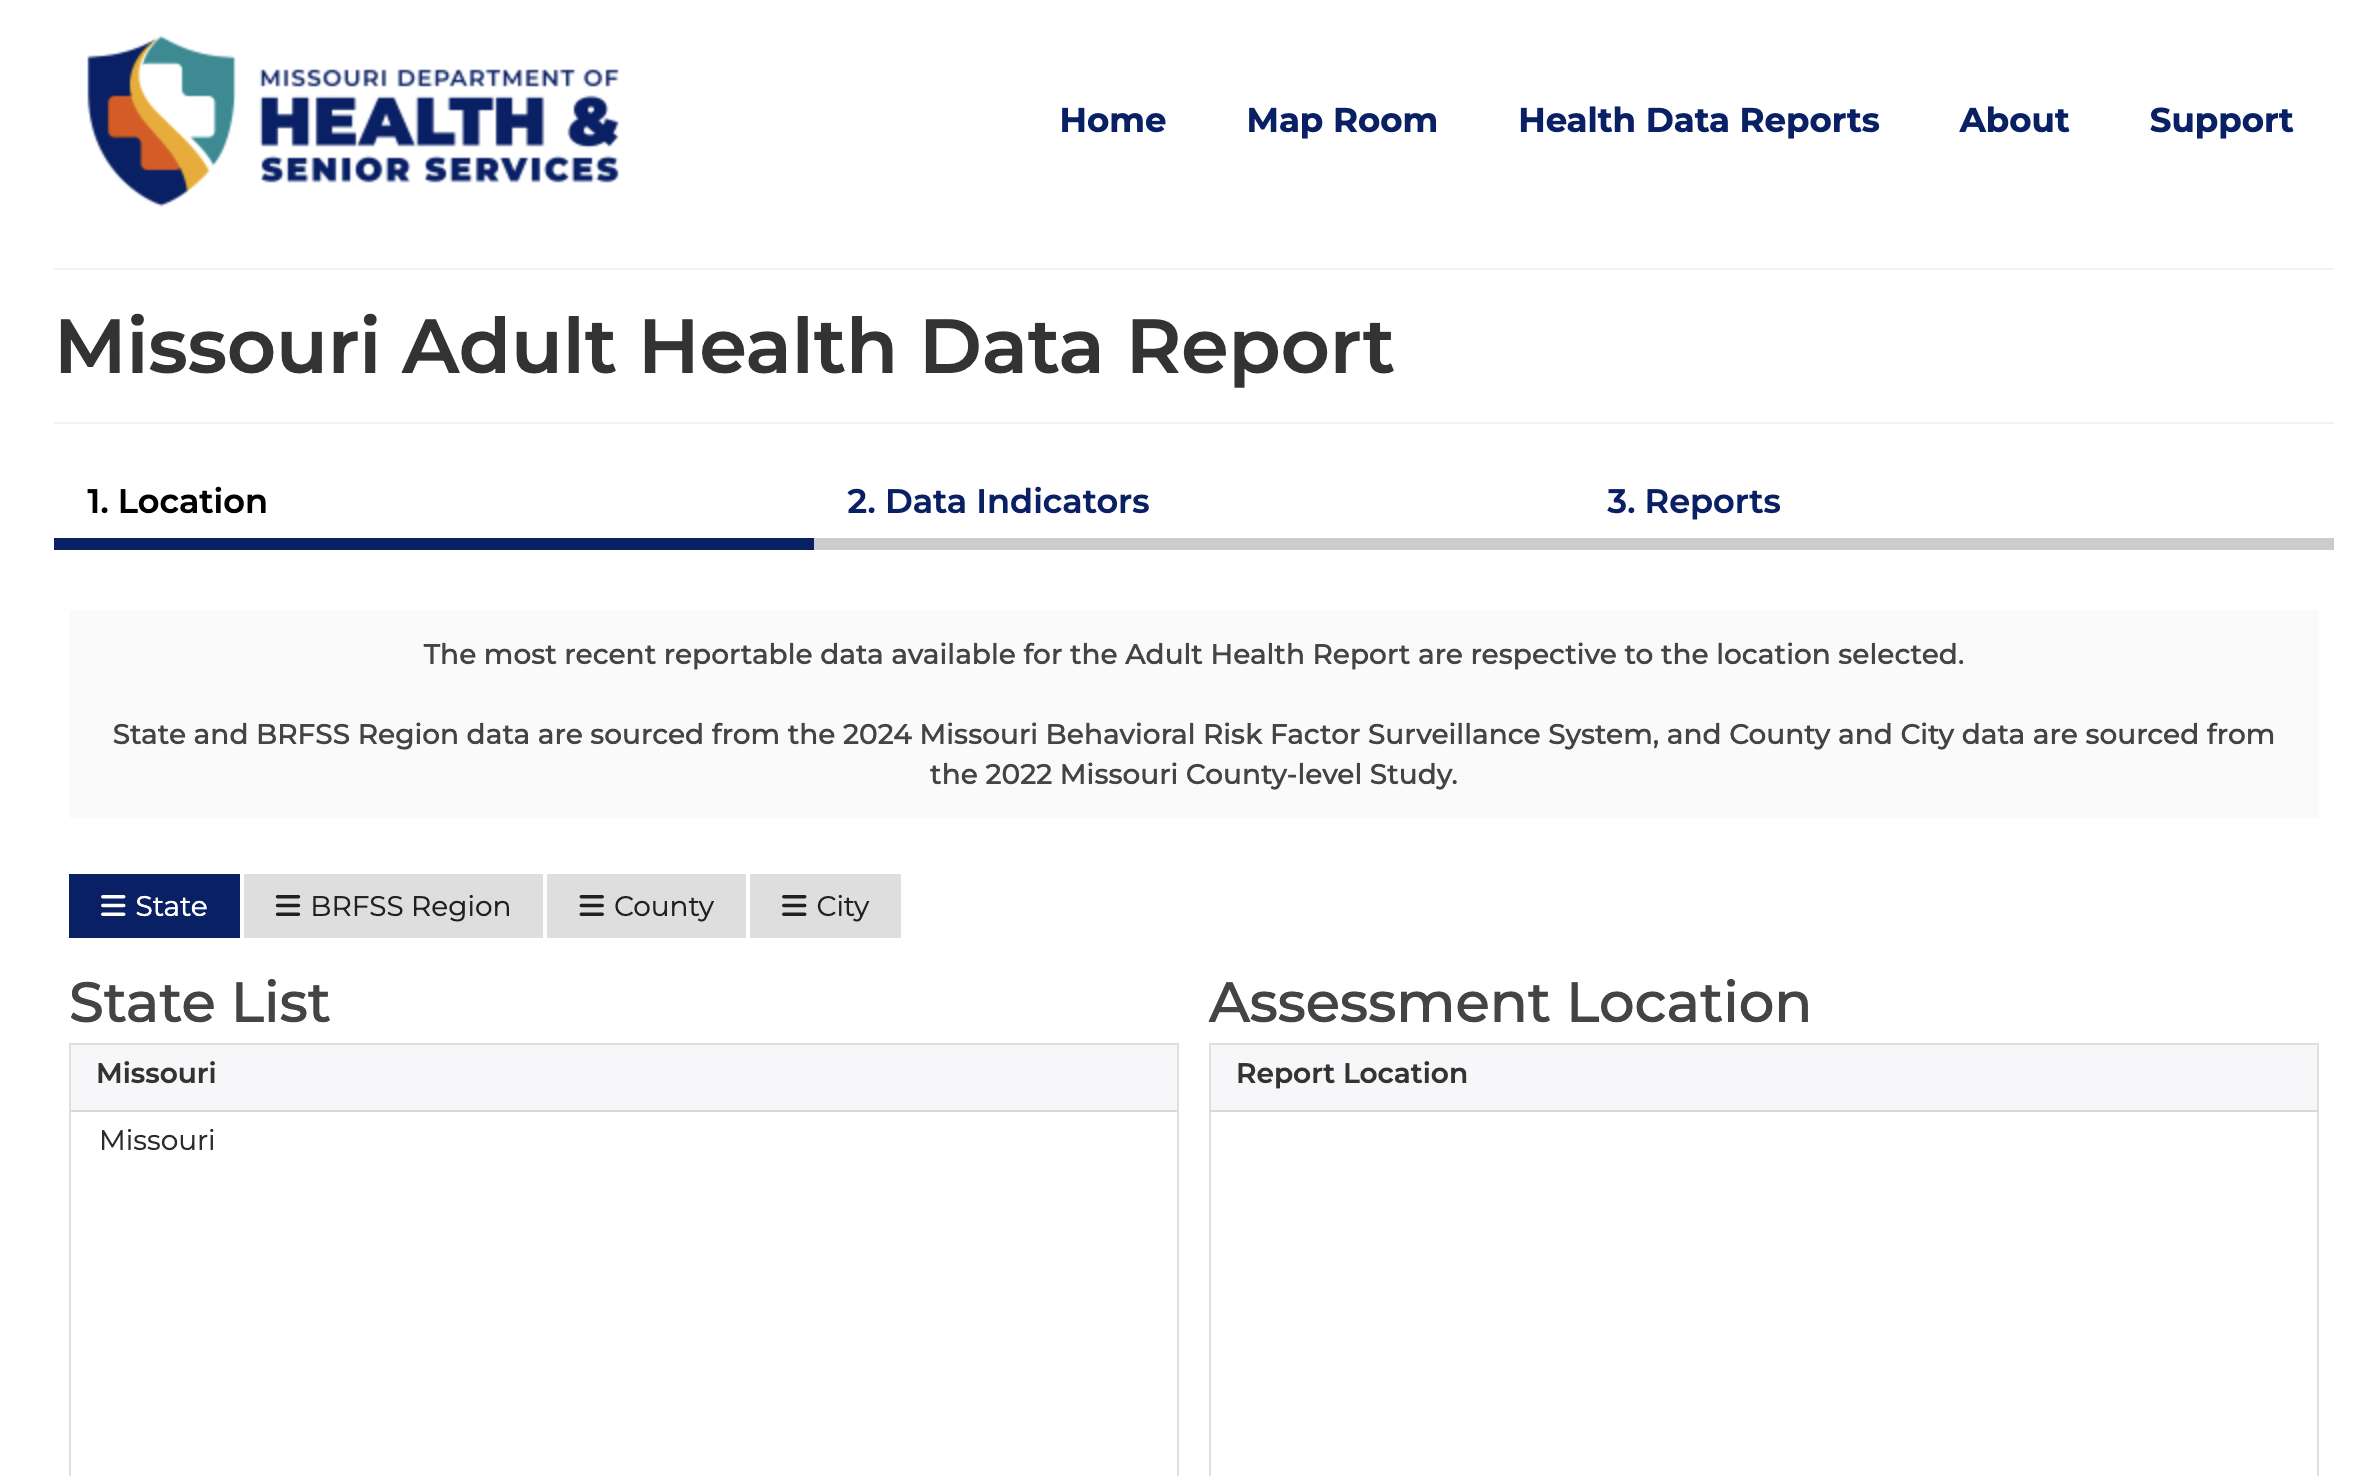
Step 1 – Select Your Location
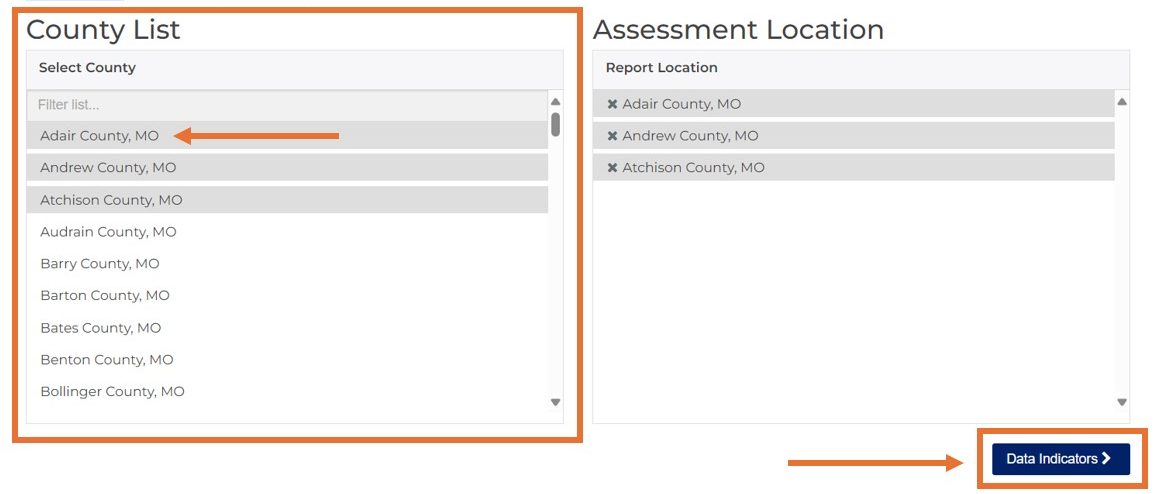
Define your report location. Click the location tabs at the top to select a location type (e.g., State, BRFSS Region, County, City).
Click the names of one or more locations from the list on the left (e.g., Adair County, Andrew County, Atchison County).
Your selections will appear, and can be managed, on the right under “Assessment Location.”
After selecting your location, click the “Data Indicators” button at the bottom right to move to Step 2.
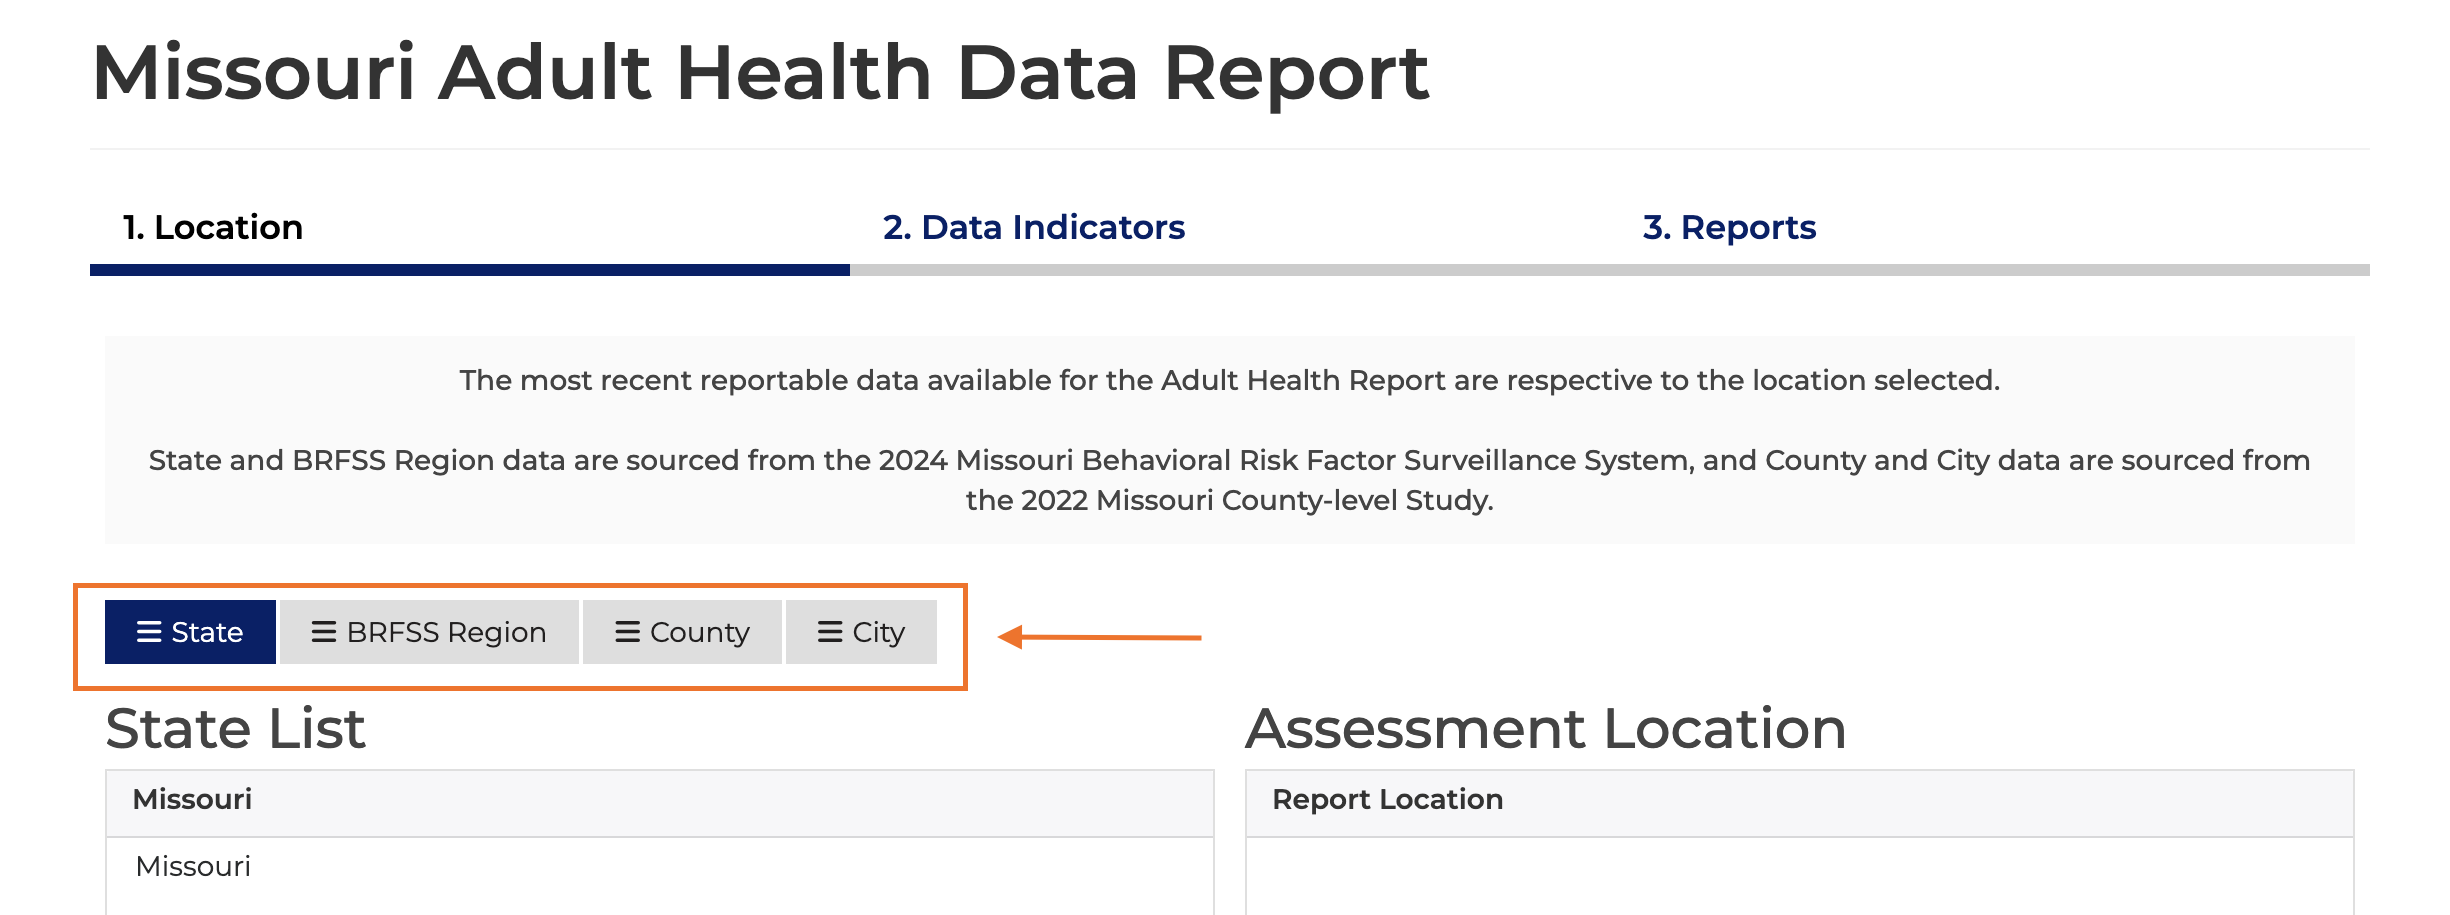
Understand What Your Choice Means
Two different datasets make up the Missouri Adult Health Data Report.
Choose State or BRFSS Region to return data from the 2024 BRFSS. BRFSS Regions are groupings of counties used to create stable, single-year estimates from survey data. Use this data for annual trends and for the most recent data.
Choose county or city to view local, more granular data from the 2022 County Level Study. The CLS is conducted at irregular intervals. Use this data for community assessments and grant writing where local estimates are needed.
Step 2 – Select Your Indicators
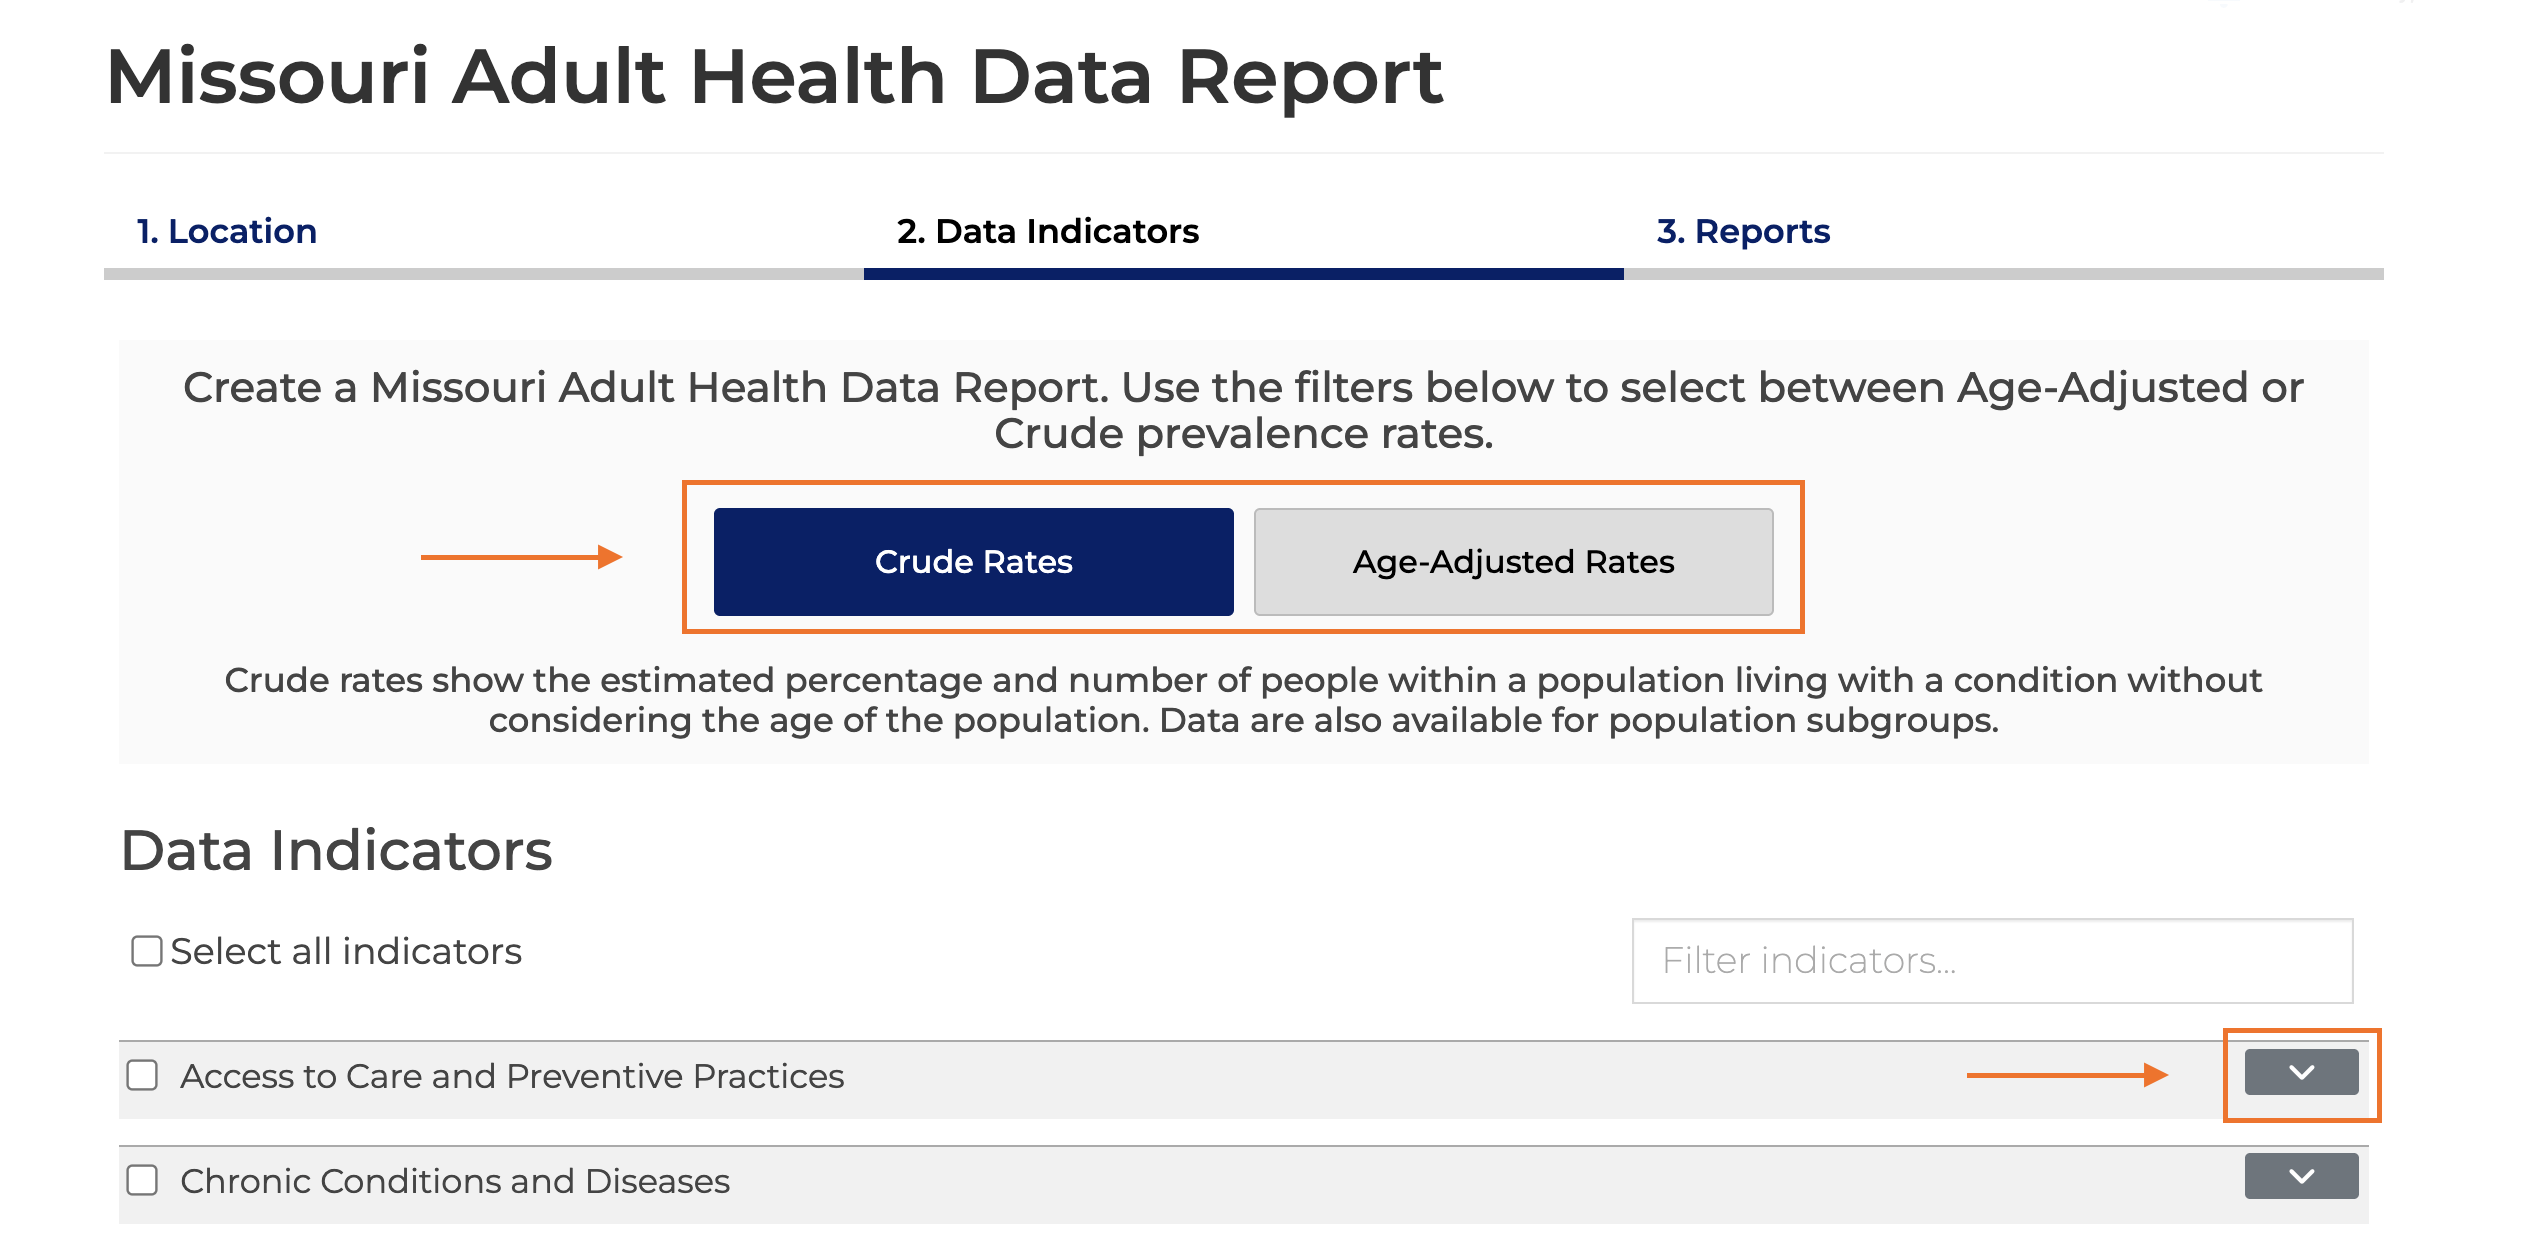
Select the data indicators you want to include in your report. Click “Crude Rates” or “Age-Adjusted Rates” based on your needs. When selecting crude rates, the report includes data for demographic groups. Age-adjusted rates do not support subgroup estimates. Click the carets on the right to expand the data categories.
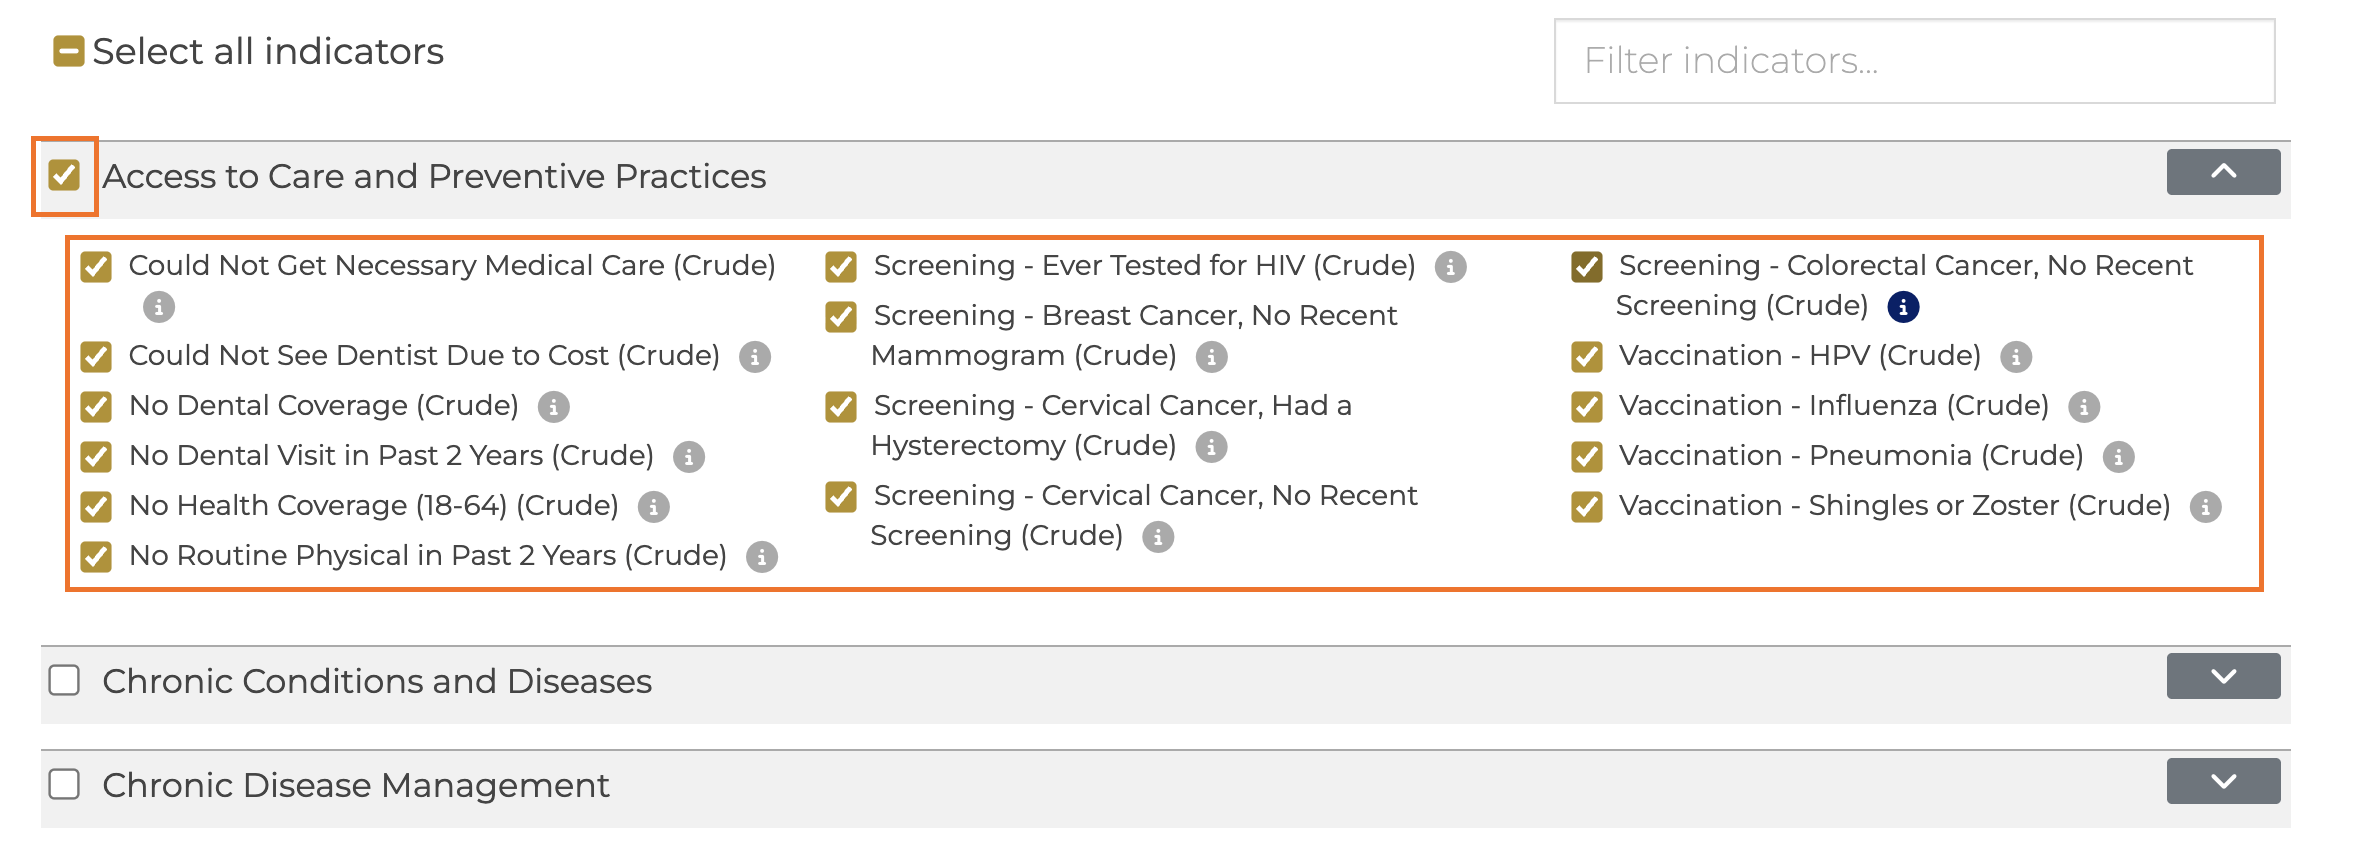
Click the check box next to the indicator name (e.g., Fair or Poor Health Status or Activity Limitation) to add single indicators to your report.
Click the check box next to the data category name (e.g., Health Status, Chronic Conditions and Diseases, Health Behaviors) to add an entire data category to your report.
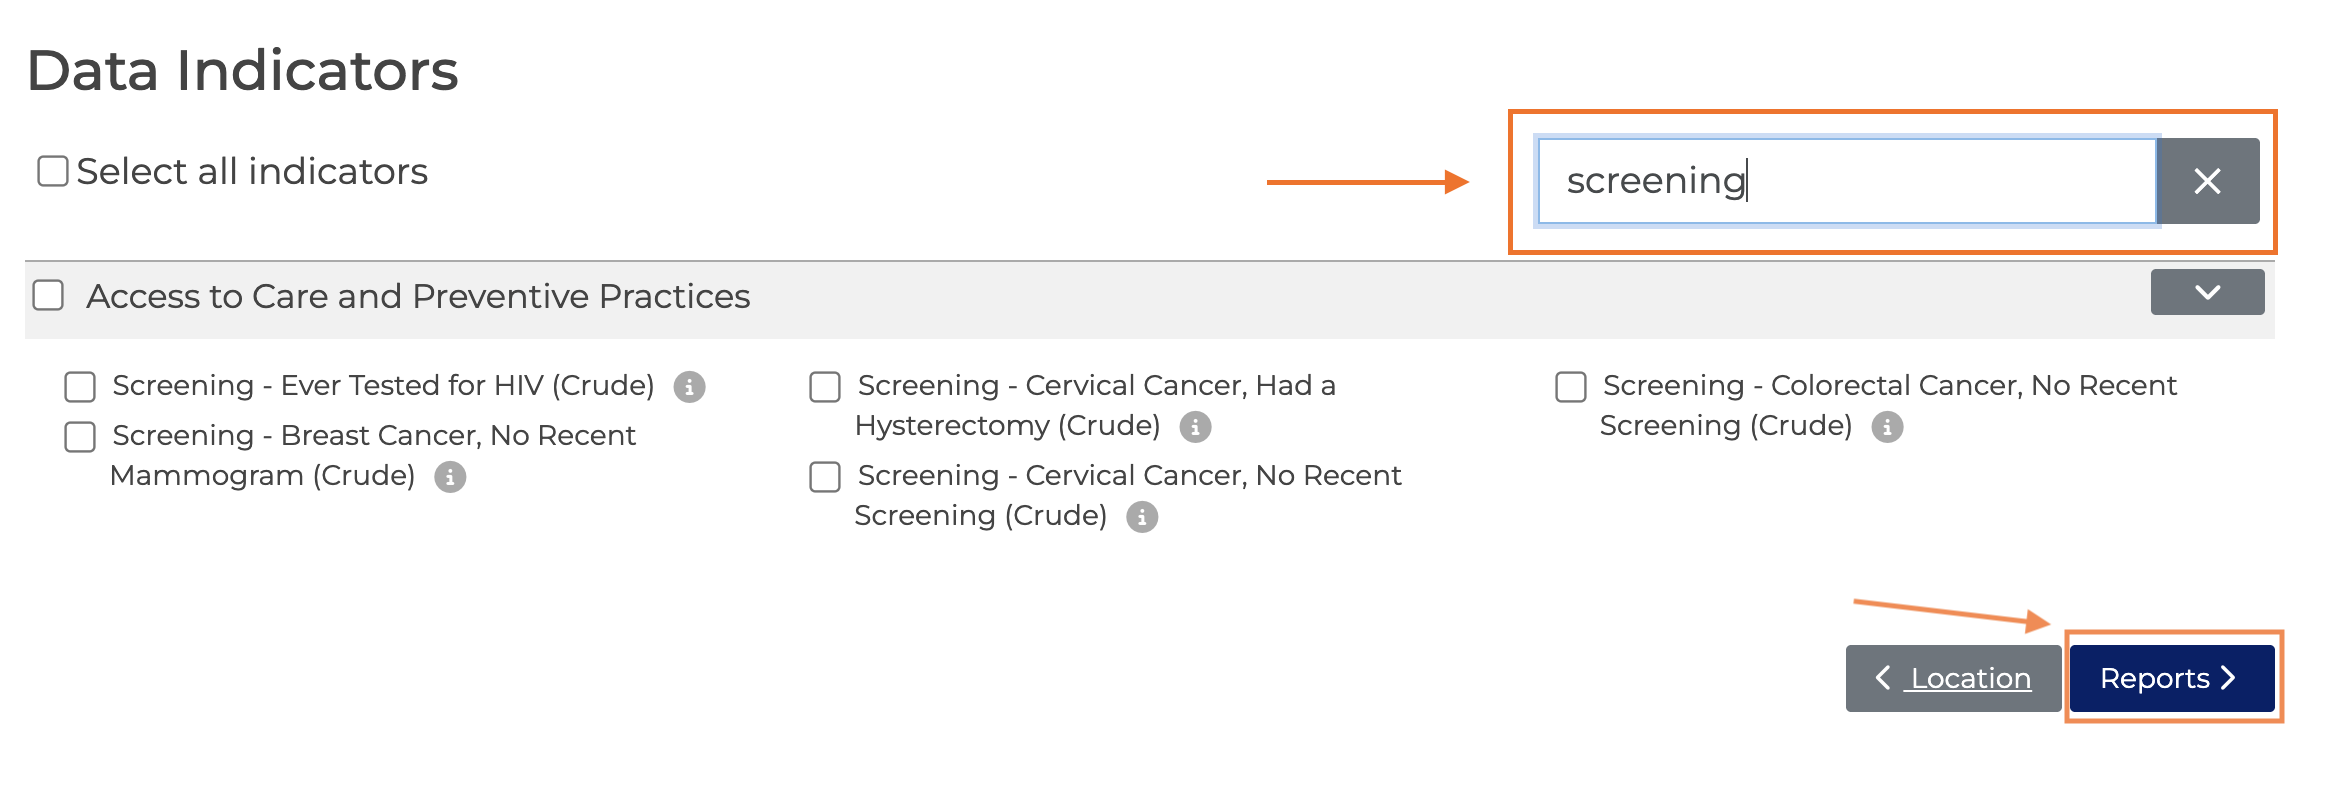
You can also filter the indicator list by typing in a search term, e.g., “screening.”
Click the “Reports” button at the bottom right to generate your report.
Step 3 – Generate and Explore Your Report
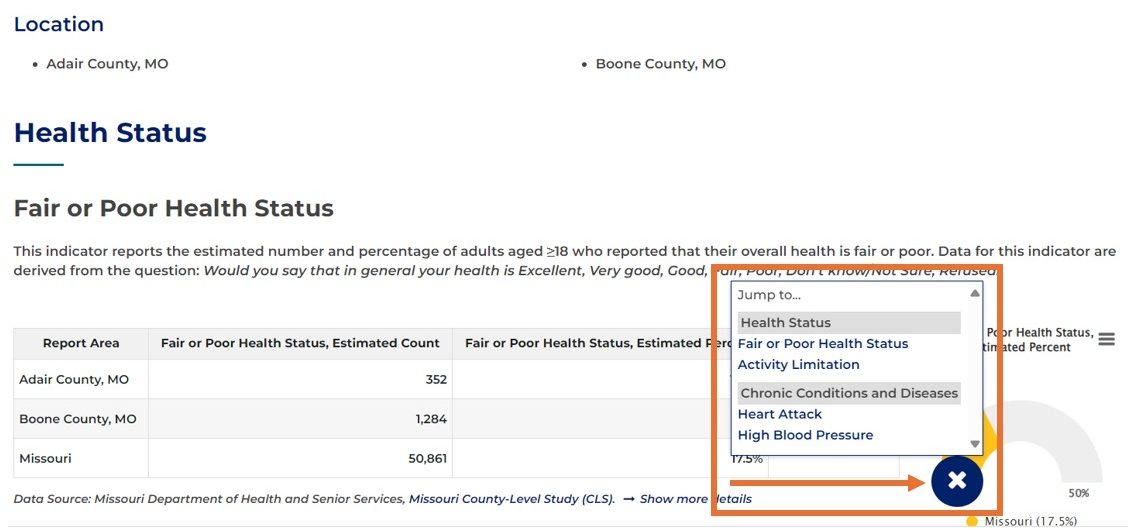
The system will compile and load the data you selected for your report. Scroll down the page or use the round menu button at the bottom to jump quickly between indicators.
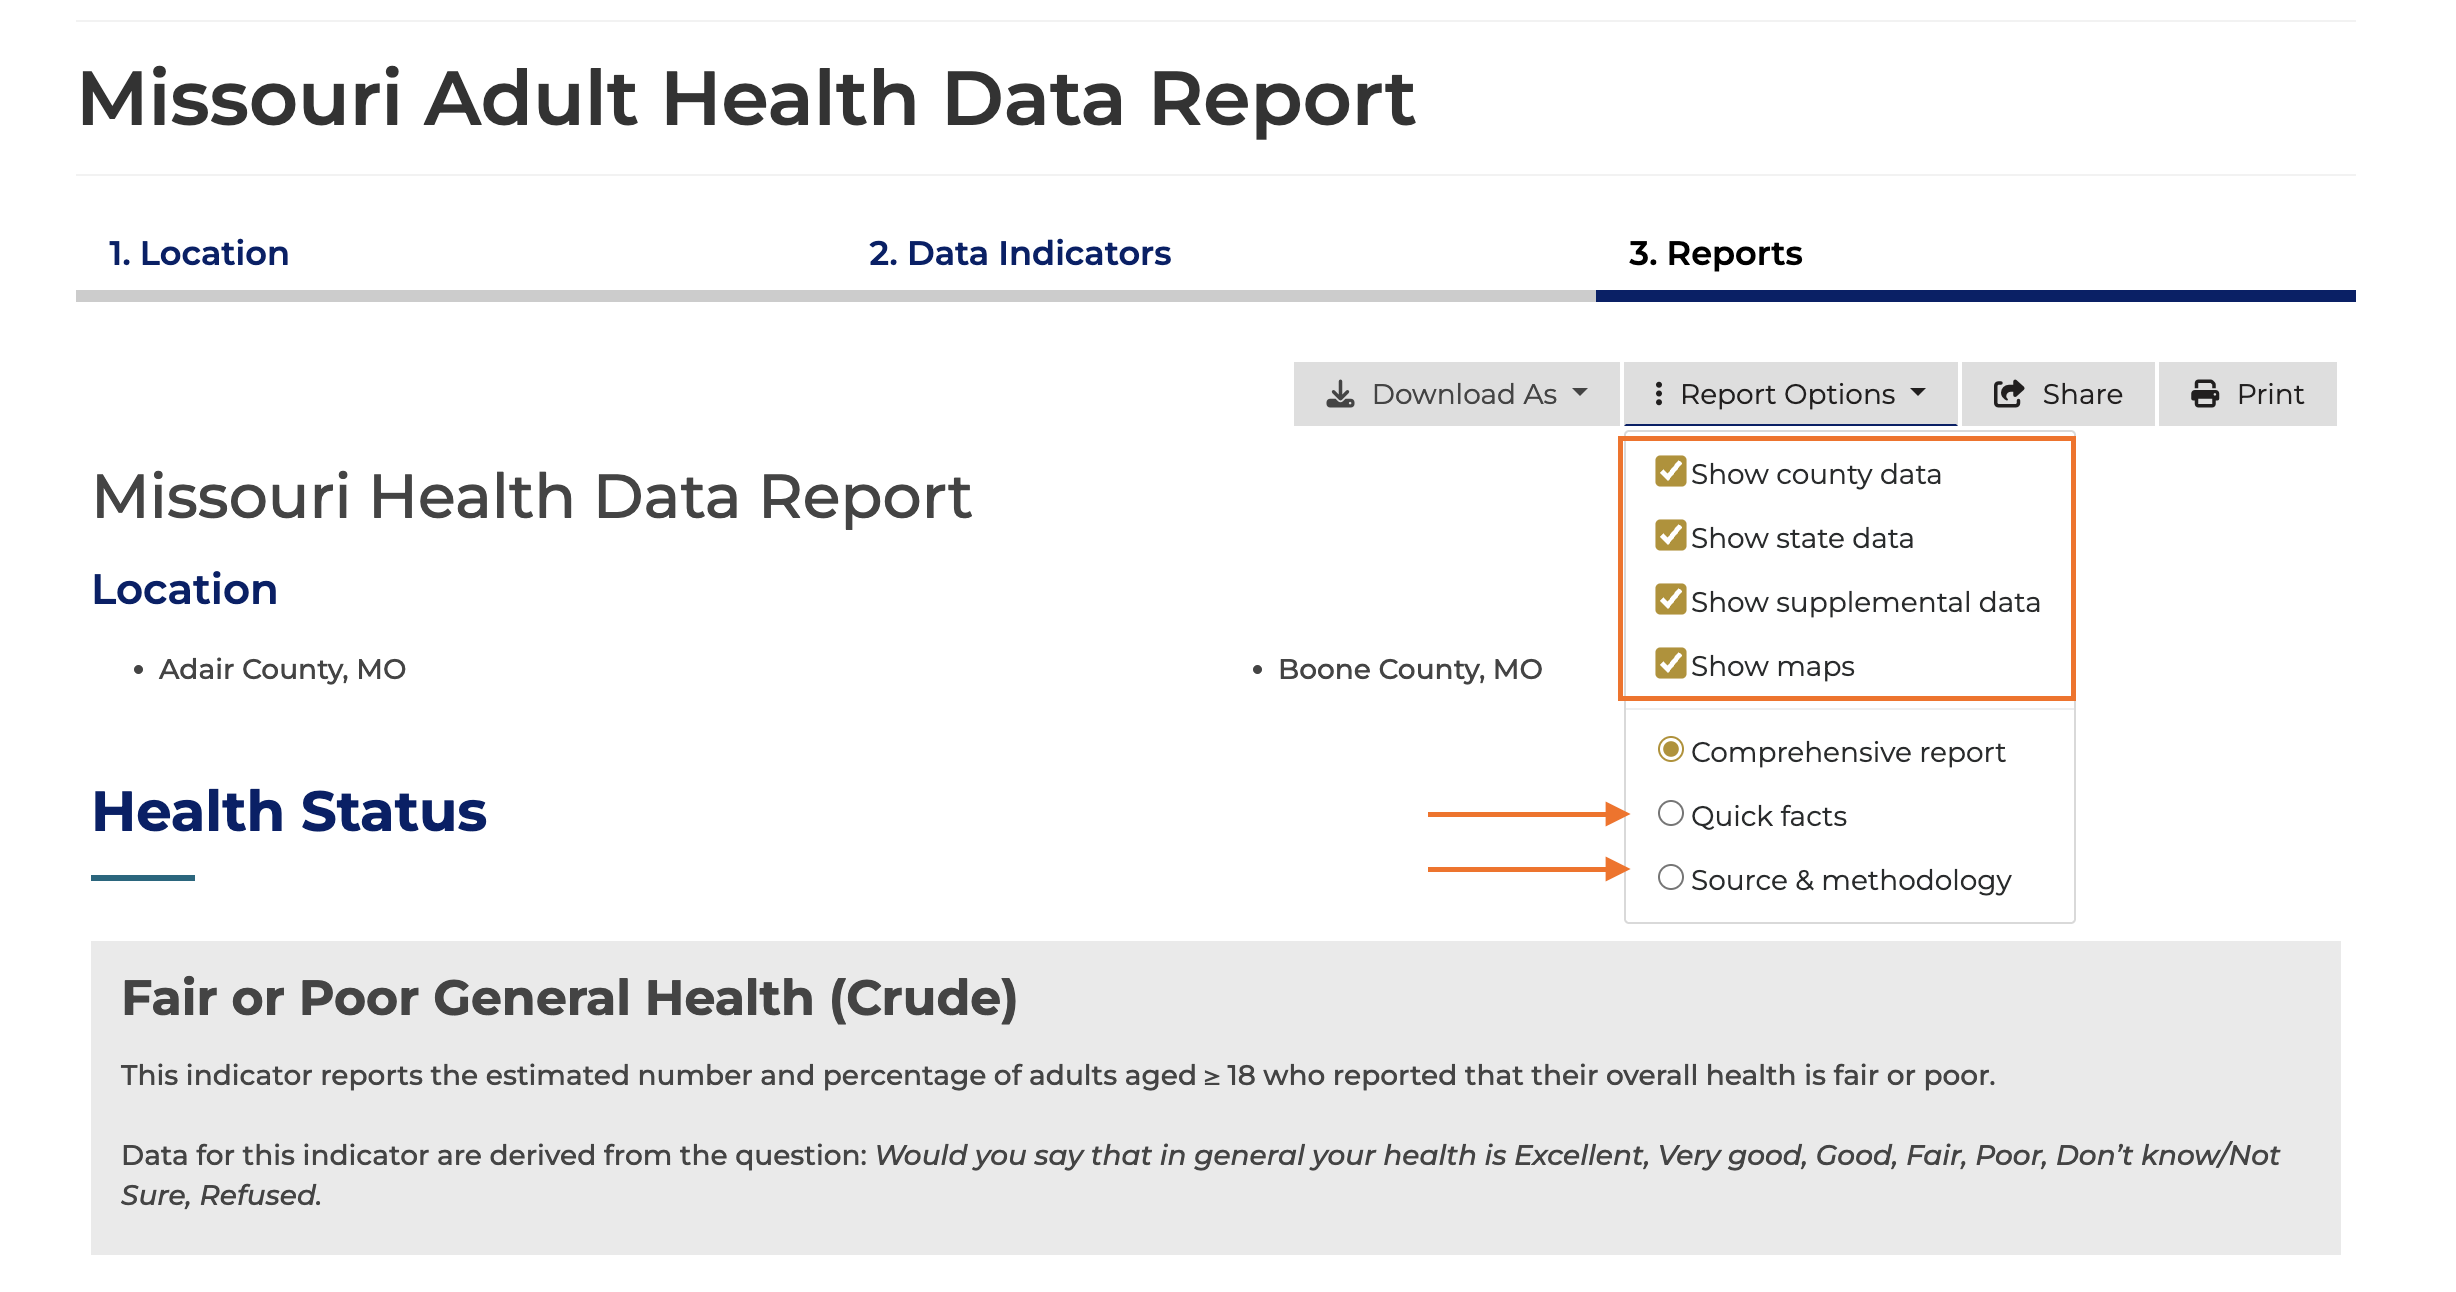
You can customize your report by expanding the Report Options pane and choosing to show or hide county and state data (if applicable), supplemental data (trends and subgroup comparisons), or maps.
The Report Options pane also provides a Quick facts report with a table-only version of the selected indicator data and a Source and methodology report.
Step 4 – Save and Download Your Report
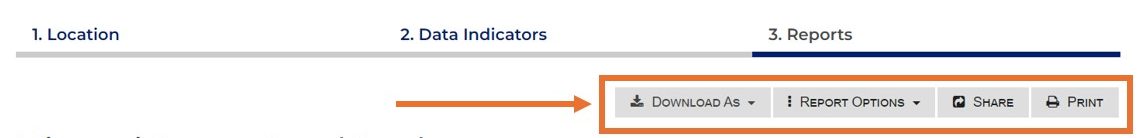
Click the “Share” button at the top of the report to share your report via link, email, or on social media.
Click the “Download As” button to download your report as a PDF file, Excel table, or Microsoft Word document.
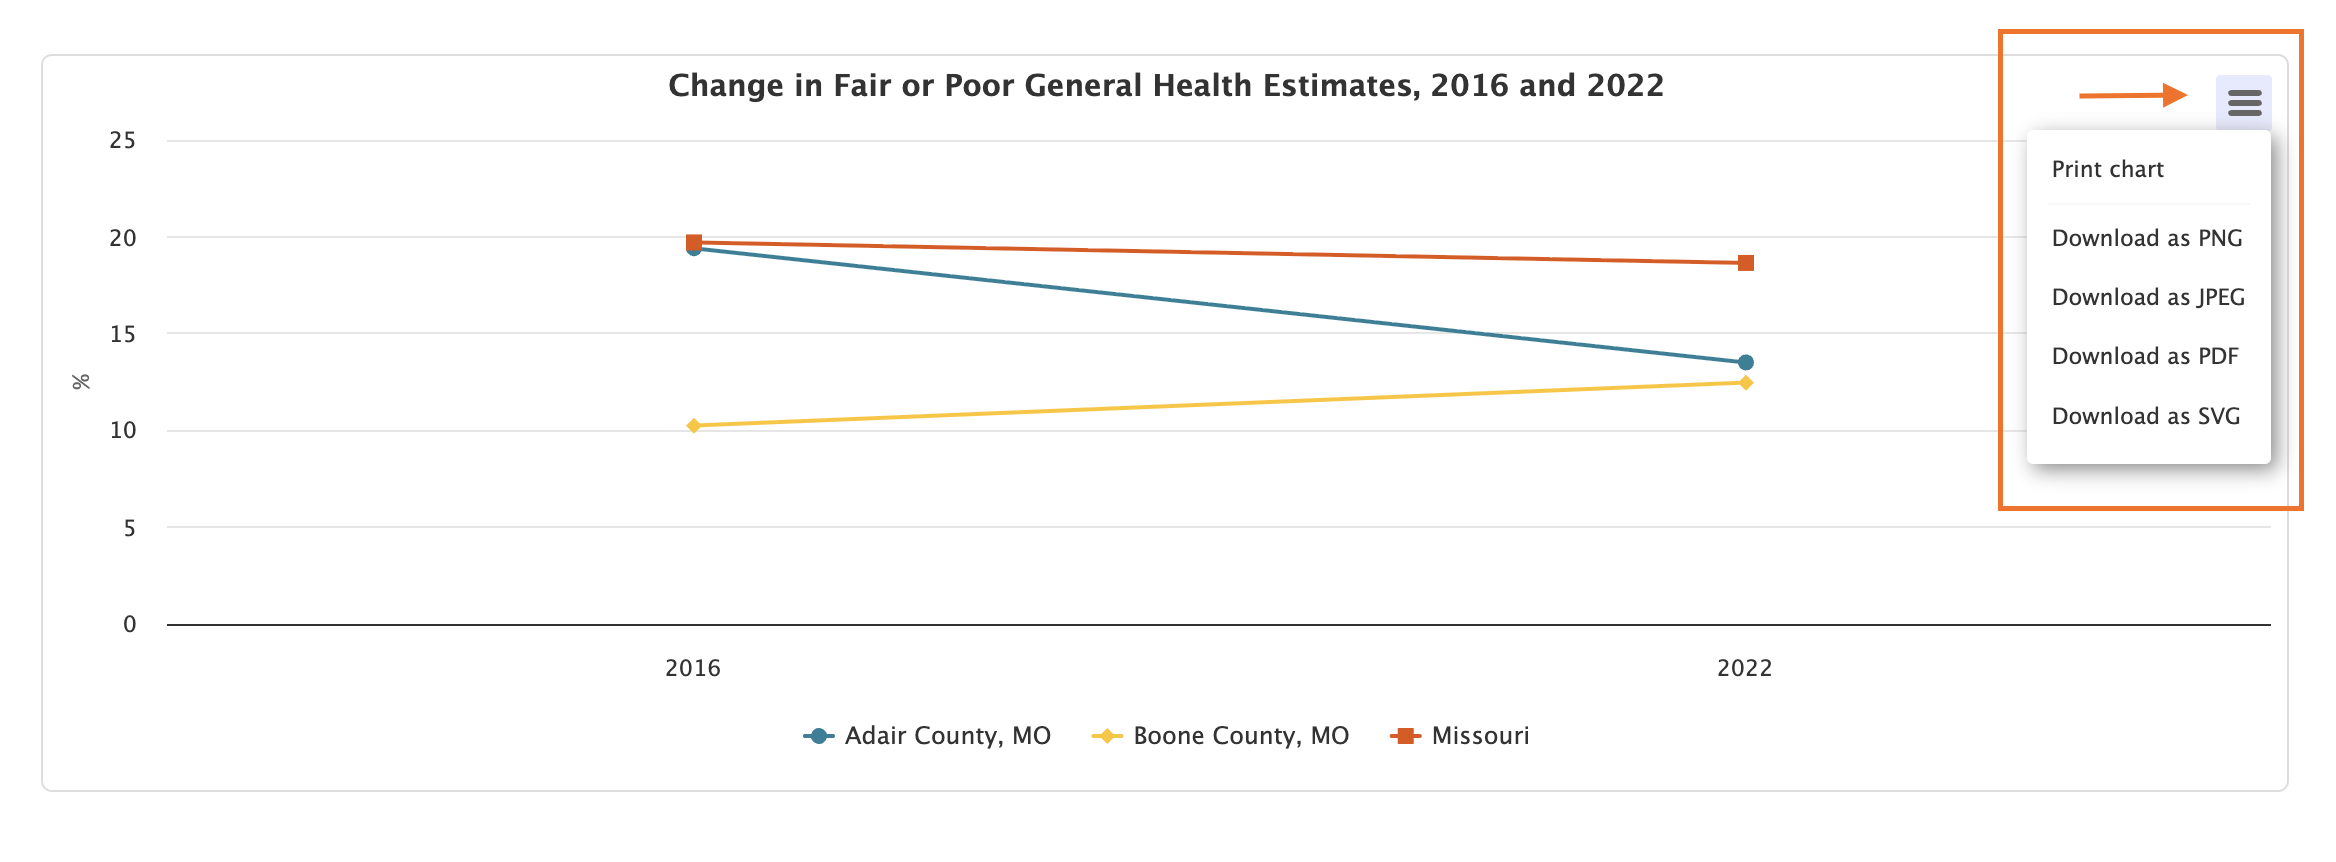
Download individual high-resolution graphics from your report by clicking the menu icon associated with each chart and choosing your download format.
Need assistance? Email us at help@cares.missouri.edu.